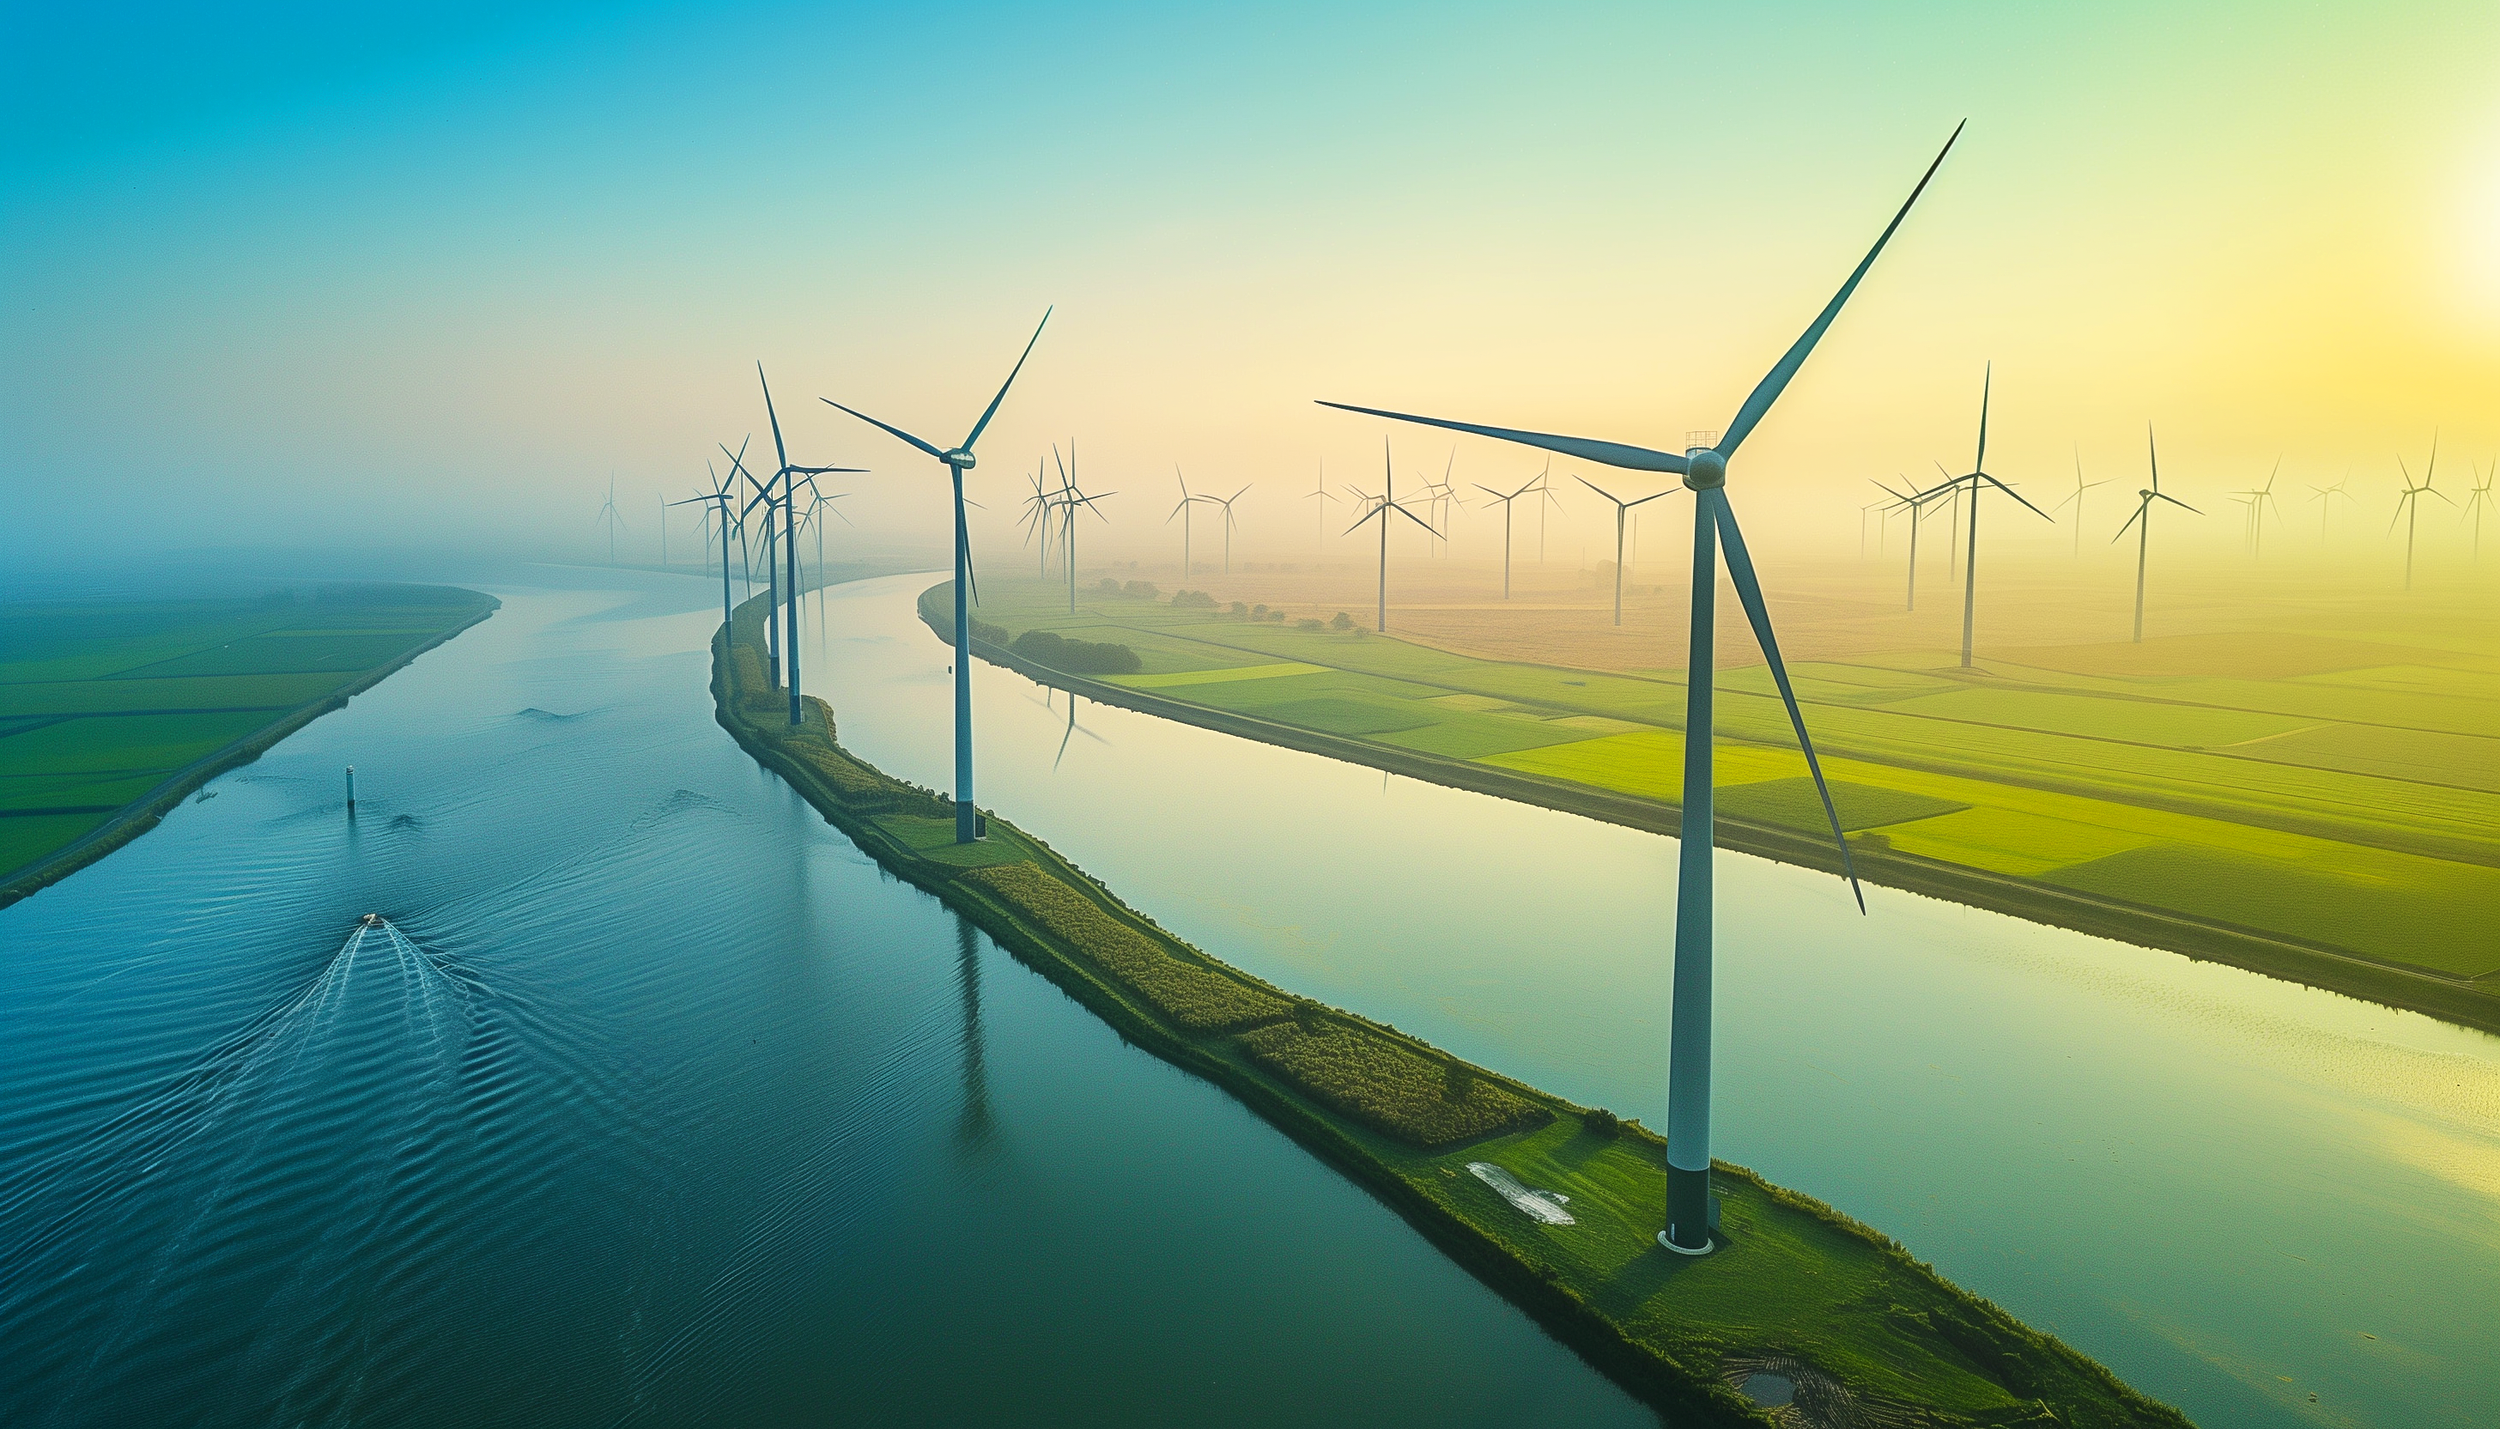
Aurora
The largest dedicated power and renewable research and financing provider in Europe, Aurora has a dedicated SAAS platform called EOS.
The two main offerings are
- Monthly energy data reports that summarise for the users how well they think a country will perform for electric prices.
- Also included in EOS are apps that have the ability to value any asset’s performance, such as a wind farm, solar panel, or battery.
This means a construction developer knows if they think a wind farm is a good investment and the most profitable place to build it
data intelligence platform redesign: news reports, charts and windfarm valuation app
Scope of work
My efforts started by focusing on a full end-to-end redesign of the EOS platform. They had quality data for predicting the future, but user insights suggested the software needed a service designer.
My service design process
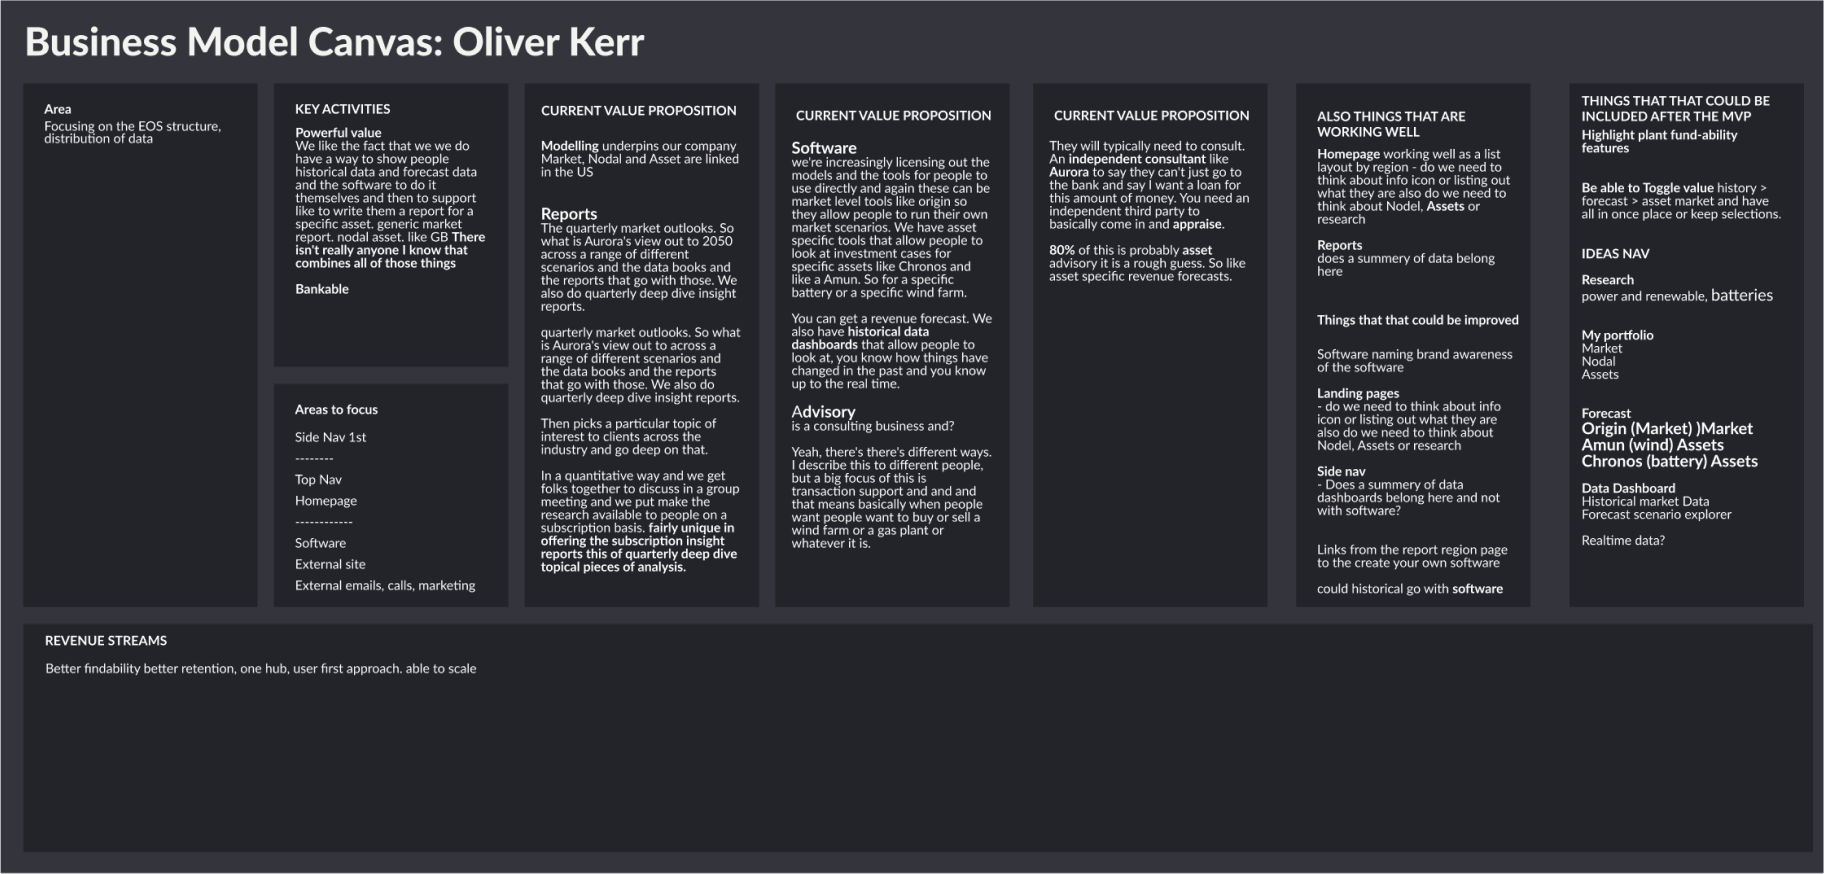
- I interviewed the business stakeholders creating a business model canvas.
- Detailed the user persona’s goals and responsibilities.
- Researched data for the current flow usage to understand the "what".
- Conducted observation interviews with users to understand the current "why" flows.
- Journey mapped to identify what is working well and what is not, added thought starters.
- Held ideation stakeholder workshops that provided more in-depth thought starters for features.
- Reviewed the users while they worked.
- Adding a new atomic design system.
- Ran tests for the new designs with observation prototype interviews and A/B tests for risk comparing metrics.
national grid map: predicting the cost of electricity anywhere
The interactive national grid map can rank the best places to build a wind farm on the voltage line by showing Aurora's predicted prices for cost and performance.
Stakeholder interviews
I began by interviewing the business stakeholders to create a business model canvas. This process helped me understand the business and gave the stakeholders a clear focus for the follow-up questions.
Detailed the user persona’s goals and responsibilities.

Observation tests
I conducted a thorough review of the users' current project software flows, identifying both usability issues and strengths. My familiarity with these interactions has consistently proven helpful.

journey map
I then held stakeholder workshops for the journey maps to identify what paths could work well and what might not, I added thought starters for small, medium and large features, these were prioritised based on value to the user and effort to build.

usability prototype tests
I conducted usability prototype tests and A/B data tests to compare risk metrics like goal completions rate and speed times.


Design
Here’s an interactive national grid map that can rank the best places to build a wind farm on the voltage line by showing Aurora's predicted prices for cost and performance.

Outcome
This process has clearly shown that defining EOS goals early helps reduce the risk for the new apps to the market.
Users can choose Aurora’s different predictions of the future to allow for different levels of risk low for conservative or high for buoyant.
Validating the assumptions before starting development addresses strategic issues. The rapid prototyping for usability testing has meant there has been an increased rate of returning use by 4% a month, a quicker core goal completion speed. Less help requests and better information architecture have meant the satisfaction survey scores are up 6 to 8.


